TradePro's 2 EMA + Stoch RSI + ATR StrategySaw TradePro's "NEW BEST HIGHEST PROFITING STRATEGY WITH CRAZY RESULTS - 2 EMA+ Stochastic RSI+ ATR", and was curious on the back testing results. This strategy is an attempt to recreate it.
This strategy uses 50 / 200 EMAs, Stochastic RSI and ATR.
Long Entry Criteria:
- 50 EMA > 200 EMA
- Price closes below 50 EMA
- Stochastic RSI has gone into oversold < 20
- Stochastic RSI crosses up while making higher low from previous cross up
Short Entry Criteria:
- 50 EMA < 200 EMA
- Price closes above 50 EMA
- Stochastic RSI has gone into overbought > 80
- Stochastic RSI crosses down while making lower high from previous cross down
Stop-loss is set to ATR stop-loss
Take Profit is 2x the risk
All parameters are configurable.
Enjoy~~
חפש סקריפטים עבור "take profit"

Ultimate Strategy Template (Advanced Edition)Hello traders
This script is an upgraded version of that one below
New features
- Upgraded to Pinescript version 5
- Added the exit SL/TP now in real-time
- Added text fields for the alerts - easier to send the commands to your trading bots
Step 1: Create your connector
Adapt your indicator with only 2 lines of code and then connect it to this strategy template.
For doing so:
1) Find in your indicator where are the conditions printing the long/buy and short/sell signals.
2) Create an additional plot as below
I'm giving an example with a Two moving averages cross.
Please replicate the same methodology for your indicator wether it's a MACD , ZigZag , Pivots , higher-highs, lower-lows or whatever indicator with clear buy and sell conditions.
//@version=5
indicator(title='Moving Average Cross', shorttitle='Moving Average Cross', overlay=true, precision=6, max_labels_count=500, max_lines_count=500)
type_ma1 = input.string(title='MA1 type', defval='SMA', options= )
length_ma1 = input(10, title=' MA1 length')
type_ma2 = input.string(title='MA2 type', defval='SMA', options= )
length_ma2 = input(100, title=' MA2 length')
// MA
f_ma(smoothing, src, length) =>
rma_1 = ta.rma(src, length)
sma_1 = ta.sma(src, length)
ema_1 = ta.ema(src, length)
iff_1 = smoothing == 'EMA' ? ema_1 : src
iff_2 = smoothing == 'SMA' ? sma_1 : iff_1
smoothing == 'RMA' ? rma_1 : iff_2
MA1 = f_ma(type_ma1, close, length_ma1)
MA2 = f_ma(type_ma2, close, length_ma2)
// buy and sell conditions
buy = ta.crossover(MA1, MA2)
sell = ta.crossunder(MA1, MA2)
plot(MA1, color=color.new(color.green, 0), title='Plot MA1', linewidth=3)
plot(MA2, color=color.new(color.red, 0), title='Plot MA2', linewidth=3)
plotshape(buy, title='LONG SIGNAL', style=shape.circle, location=location.belowbar, color=color.new(color.green, 0), size=size.normal)
plotshape(sell, title='SHORT SIGNAL', style=shape.circle, location=location.abovebar, color=color.new(color.red, 0), size=size.normal)
/////////////////////////// SIGNAL FOR STRATEGY /////////////////////////
Signal = buy ? 1 : sell ? -1 : 0
plot(Signal, title='🔌Connector🔌', display = display.data_window)
Basically, I identified my buy, sell conditions in the code and added this at the bottom of my indicator code
Signal = buy ? 1 : sell ? -1 : 0
plot(Signal, title="🔌Connector🔌", transp=100)
Important Notes
🔥 The Strategy Template expects the value to be exactly 1 for the bullish signal, and -1 for the bearish signal
Now you can connect your indicator to the Strategy Template using the method below or that one
Step 2: Connect the connector
1) Add your updated indicator to a TradingView chart
2) Add the Strategy Template as well to the SAME chart
3) Open the Strategy Template settings and in the Data Source field select your 🔌Connector🔌 (which comes from your indicator)
From then, you should start seeing the signals and plenty of other stuff on your chart
🔥 Note that whenever you'll update your indicator values, the strategy statistics and visual on your chart will update in real-time
Settings
- Color Candles: Color the candles based on the trade state ( bullish , bearish , neutral)
- Close positions at market at the end of each session: useful for everything but cryptocurrencies
- Session time ranges: Take the signals from a starting time to an ending time
- Close Direction: Choose to close only the longs, shorts, or both
- Date Filter: Take the signals from a starting date to an ending date
- Set the maximum losing streak length with an input
- Set the maximum winning streak length with an input
- Set the maximum consecutive days with a loss
- Set the maximum drawdown (in % of strategy equity)
- Set the maximum intraday loss in percentage
- Limit the number of trades per day
- Limit the number of trades per week
- Stop-loss: None or Percentage or Trailing Stop Percentage or ATR - I'll add shortly multiple options for the trailing stop loss
- Take-Profit: None or Percentage or ATR - I'll add also a trailing take profit
- Risk-Reward based on ATR multiple for the Stop-Loss and Take-Profit
Special Thanks
Special thanks to @JosKodify as I borrowed a few risk management snippets from his website: kodify.net
Best
Dave

FFT Strategy Bi-Directional Stop/Profit/Trailing + VMA + AroonThis strategy uses the Fast Fourier Transform inspired from the source code of @tbiktag for the Fast Fourier Transform & @lazybear for the VMA filter.
If you are not familiar with the Fast Fourier transform it is a variation of the Discrete Fourier Transform. Veritasium on youtube has a great video on it with a follow up recommendation from 3brown1blue. In short it will extract all the frequencies from a set of data. @tbiktag laid the groundwork for creating the indicator which will allow you to isolate only those signals which are the most relevant and remove the noise. I recommend having @tbiktag's FFT Transform indicator side by side with this to understand what my variation is doing by setting similar settings .
Using this idea, you can then optimize a strategy to the frequencies that are best. The main entry signal is when the FFT Signal crosses above or below the 0 line .
Included with this strategy is the ability to optionally bi-directionally set:
Stop Loss
Trailing Stop Loss
Take Profit
Trailing Take Profit
Entries are optionally further filtered by use of the VMA using the algorithm from LazyBear which allows you to adjust a variable moving average with 3 market trend detections. Green represents upwards momentum; Blue sideways trading and Red downwards momentum. The idea being to filter out buy or sell entries unless the market is moving in that direction, and this makes a big difference as you can see for yourself when you turn it off or on. Turning it off will change the color of the FFT signal to orange instead of the green, blue, red colors .
I have added 2 custom stop loss types as well for experimentation:
1. VMA Filter stop loss to exit the trade if the VMA detects a market trend direction change matching the rules you have set. I have set this to off by default, but it is there so you can see what affect it may have on other tickers. It can increase the profit factor but usually at a cost of net profit.
2. The Aroon Filter stop loss with different lengths for the short or long direction. For the Aroon strategy (which is a trend change detector) it is considered bullish if the upper line (green in my code) is above 70 and the lower line (red in my code) is below 30 and the opposite for the bearish case. With this in mind, I have set it to filter by default only the extreme ends (99 and 1) to increase profit factor and net profit but I encourage you to try different settings and see how it affects things. Turning this off yields much higher net profit but at the cost of the profit factor and drawdown . To disable this just uncheck the 'Use Aroon Filter Long' (or short) and it will also hide the aroon graphics and crosses on the plot.
I will be adding more features in an attempt to lower the drawdown on this strategy but I hope you enjoy what I have so far!

Trend #4 - ATR+EMA channelOverview:
This strategy use ATR to take-profit, Red-EMA to stop-loss, Blue-EMA channel to judgment breakout.
This strategy use commission setting is 0.05%, slippage setting is 2 ticks, you can set the appropriate value size in the properties page.
What it does:
This strategy detects when a trend is emerging and buy or sell.
How it does it:
When the price breaks through the blue EMA channel, the trend is judged to be strong in the short term, strategy generates a buy or sell order.
After buying or selling,, if the price moves in the expected direction, uses ATR to determine the appropriate spread to take profit, otherwise use red EMA for stop loss.
How to use it:
Start Date and Stop Date - This parameter adjusts the time range used by the strategy.
Stoploss - This parameter adjusts the stop loss amount after each order is placed.
Blue EMA length - This parameter adjusts the length of the channel.
Blue EMA multy - This parameter adjusts the width of the top and bottom of the channel.
ATR Period - This parameter adjusts the number of candles used by the ATR.
ATR mult - This parameter adjusts the upper and lower widths of the ATR. Lowering this parameter can improve the win rate, but not necessarily the profitability.
Red EMA length - This parameter adjusts the number of candles used by the red EMA .
Long - This switch is used to turn Long position on or off.
Short - This switch is used to turn short position on or off.

Position Tool█ OVERVIEW
This script is an interactive measurement tool that can be used to evaluate or keep track of trades. Like the long and short position drawing tools, it calculates a risk reward ratio and a risk-adjusted position size from the entry, stop and take profit levels, but it also does much more:
• It can be used to configure long or short trades.
• All monetary values can be expressed in any number of currencies.
• The value of tick/pip movement (which varies with the position's size) is displayed in the currency you have selected.
• The CAGR ( Compound Annual Growth Rate ) for the trade can be displayed.
• It does live tracking of the position.
• You can configure alerts on entries and exits.
█ HOW TO USE IT
Load the indicator on an active chart (see here if you don't know how).
When you first load this script on a chart, you will enter an interactive selection mode where the script asks you to pick three points in price and time on your chart by clicking on the chart. Directions will appear in a blue box at the bottom of the screen with each click of the mouse. The first selection is the entry point for the trade you are considering, which takes into account both the time and level you choose, the next are the take profit and stop levels. Once you have selected all three points, the script will draw trade zones and labels containing the trade metrics. The script determines if the trade is a long or short from the position of the take profit and stop loss levels in relation to the entry price. If the take profit level is above the entry price, the stop must be below and vice versa, otherwise an error occurs.
You can change levels by dragging the handles that appear when you select the indicator, or by entering new values in the script's settings. The only way to re-enter interactive mode is to re-add the indicator to your chart.
Once you place the position tool on a chart, it will appear at the same levels on all symbols you use. If your scale is not set to "Scale price chart only", the position tool's levels will be taken into account when scaling the chart, which can cause the symbol's bars to be compressed. If your scale is set to "Scale price chart only", the position tool will still be there, but it will not impact the scale of the chart's bars, so you won't see it if it sits outside the symbol's price scale.
If you select the position tool on your chart and delete it, this will also delete the indicator from the chart. You will need to re-add it if you want to draw another position tool. You can add multiple instances of the indicator if you need a position tool on more than one of your charts.
█ FEATURES
Display
The position tool displays the following information for entries:
• The entry's price level with an '@' sign before it.
• Open or Closed P&L : For an open trade, the "Open P&L" displays the difference in money value between the entry level and the chart's current price.
For a closed trade, the "Closed P&L" displays the realized P&L on the trade.
• Quantity : The trade size, which takes into account the risk tolerance you set in the script's settings.
• RR : The reward to risk ratio expresses the relationship of the distance between the entry and the take profit level vs the entry and the stop level.
Example: A $100 stop with a $100 target will have a ratio of 1:1, whereas a $200 target with the same stop will have a 2:1 ratio.
• Per tick/pip : Represents the money value of a tick or pip movement.
• CAGR : The Compound Annual Growth Rate will be displayed on the main order label on trades that exceed one day in duration.
This value is calculated the same way as in our CAGR Custom Range indicator.
If the trade duration is less than one day, the metric will not be present in the display.
The stop and take profit levels display:
• Their price level with an '@' sign before it.
• Their distance from the entry in money value, percentage and ticks/pips.
• The projected end money value of the position if the level is reached. These values are calculated based on the trade size and the currency.
Currency adjustments
This indicator modifies the trade label's colors and values based on the final Profit and Loss (P&L), which considers the dynamic exchange rate between base and conversion currencies in its calculations when the conversion currency is a specified value other than the default. Depending on the cross rate between the base and account currencies, this process can yield a negative P&L on an otherwise successful simulated trade.
For instance, if your account is in currency XYZ, you might buy 10 Apple shares at $150 each, with the XYZ to USD exchange rate being 2:1. This purchase would cost you 3000 units of XYZ. Suppose that later on, the shares appreciate to $170 each, and you decide to sell. One might expect this trade to result in profit. However, if the exchange rate has now equalized to 1:1, the return on selling the shares, calculated in XYZ, would only be 1700 units, resulting in a loss of 1300 units XYZ.
The indicator will mark the P&L and the target labels in red in such cases, regardless of whether the market price reached the profit target, as the trade produced a net loss due to reduced funds after currency conversion. Conversely, an otherwise unsuccessful position can result in a net profit in the account currency due to conversion rate fluctuations. The final losses or gains appear in the label metrics, and the corresponding color coding reflects the trade's success or failure.
Settings
The settings in the "Trade sizing" section are used to calculate the position size and the monetary value of trades. Two types of risk can be chosen from the menu; a percentage based risk calculation, or a fixed money value. The risk is used to calculate the quantity of units to purchase to achieve that level of risk exposure. Example: An account size of $1000 and 10% risk will have a projected end amount of $900 if the stop loss is hit. The quantity is a product of this relationship; a projected number of units to allow for the equivalent of $100 of risk exposure over the change in price from the entry to the stop value.
The "Trade levels" allow you to manually set the entry, take profit and stop levels of an existing position tool on your chart.
You can control the appearance of the tool and the values it displays in the settings following these first two sections.
Alerts
Three alerts that will trigger when you configure an alert on this indicator. The first will send an alert when the entry price is breached by price action if that price has not already been breached in the previous price history. This is dependant on the entry location you select when placing the indicator on the chart. The other two alerts will trigger when either the stop loss or the take profit level is breached to signal that a trade exit has occurred.
█ NOTES FOR Pine Script™ CODERS
• Interactive inputs are implemented for input.time() and input.price() . These specialized input functions allow users to interact with a script.
You can create one interactive input for both time and price values by using the same `inline` argument in a pair of input.time() and input.price() function calls.
• We use the `cagr()` function from our ta library.
• The script uses the runtime.error() function to throw an error if the stop and limit prices are not placed on opposing sides of the entry price.
• We use the `currency` parameter in a request.security() call to convert currencies.
Look first. Then leap.

[D] Dudu 95 Strategy Template ver.1.1.Hello Guys! Nice to meet you all!
This is my Second script after changing My Profile Name!
I updated my strategy template before - I added some filter conditions (EMA, ADX, DMI).
If there's something to update, I will update this script!
Thank you!
-----
I made this based on the open source strategies by jason5480, kevinmck100, myncrypto.
Thank you All!
### Filter
1. Can Choose whether to use filter.
2. Filters Based on ATR, EMA, ADX, and DMI are ready to use.
### StopLoss
1. Can Choose Stop Loss Type: Percent, ATR, Previous Low / High.
2. Can Chosse inputs of each Stop Loss Type.
### Take Profit
1. Can set Risk Reward Ratio for Take Profit.
- To simplify backtest, I erased all other options except RR Ratio.
- You can add Take Profit Logic by adding options in the code.
2. Can set Take Profit Quantity.
### Risk Manangement
1. Can choose whether to use Risk Manangement Logic.
- This controls the Quantity of the Entry.
- e.g. If you want to take 3% risk per trade and stop loss price is 6% below the long entry price,
then 50% of your equity will be used for trade.
2. Can choose How much risk you would take per trade.
### Plot
1. Added Labels to check the data of entry / exit positions.
2. Changed and Added color different from the original one. (green: #02732A, red: #D92332, yellow: #F2E313)

[DuDu95] SSL 4C MACD Laugerre RSI StrategyHello Guys! Nice to meet you all!
Before I start, my nickname has changed to 'DuDu95'!!
This is the Strategy introduced by youtube channel.
I made this based on the open source indicator by kevinmck100, vkno422, KivancOzbilgic. Thank you All!
### Entry Logic
1. Long Entry Logic
- close > SSL Hybrid baseline upper k (keltner channel)
- macd signal > 0 and current MACD value > previous MACD value
- Laguerre RSI < overbought Line.
2. short Entry Logic
- close < SSL Hybrid baseline lower k (keltner channel)
- macd signal < 0 and current MACD value < previous MACD value
- Laguerre RSI > overbought Line.
### Exit Logic
1. Long Exit Logic
- close < SSL Hybrid baseline lower k (keltner channel)
- macd signal < 0
2. short Entry Logic
- close > SSL Hybrid baseline upper k (keltner channel)
- macd signal > 0
### StopLoss
1. Can Choose Stop Loss Type: Percent, ATR, Previous Low / High.
2. Can Chosse inputs of each Stop Loss Type.
### Take Profit
1. Can set Risk Reward Ratio for Take Profit.
- To simplify backtest, I erased all other options except RR Ratio.
- You can add Take Profit Logic by adding options in the code.
2. Can set Take Profit Quantity.
### Risk Manangement
1. Can choose whether to use Risk Manangement Logic.
- This controls the Quantity of the Entry.
- e.g. If you want to take 3% risk per trade and stop loss price is 6% below the long entry price,
then 50% of your equity will be used for trade.
2. Can choose How much risk you would take per trade.
### Plot
1. Added Labels to check the data of entry / exit positions.
2. Changed and Added color different from the original one. (green: #02732A, red: #D92332, yellow: #F2E313)

[fpemehd] Strategy TemplateHello Guys! Nice to meet you all!
This is my fourth script!
This is the Strategy Template for traders who wants to make their own strategy.
I made this based on the open source strategies by jason5480, kevinmck100, myncrypto. Thank you All!
### StopLoss
1. Can Choose Stop Loss Type: Percent, ATR, Previous Low / High.
2. Can Chosse inputs of each Stop Loss Type.
### Take Profit
1. Can set Risk Reward Ratio for Take Profit.
- To simplify backtest, I erased all other options except RR Ratio.
- You can add Take Profit Logic by adding options in the code.
2. Can set Take Profit Quantity.
### Risk Manangement
1. Can choose whether to use Risk Manangement Logic.
- This controls the Quantity of the Entry.
- e.g. If you want to take 3% risk per trade and stop loss price is 6% below the long entry price,
then 50% of your equity will be used for trade.
2. Can choose How much risk you would take per trade.
### Plot
1. Added Labels to check the data of entry / exit positions.
2. Changed and Added color different from the original one. (green: #02732A, red: #D92332, yellow: #F2E313)

SuperTrend Entry(My goal creating this indicator) : Provide a way to enter the market systematically, automatically create Stop Loss Levels and Take Profit Levels, and provide the position size of each entry based on a fix Percentage of the traders account.
The Underlying Concept :
What is Momentum?
The Momentum shown is derived from a Mathematical Formula, SUPERTREND. When price closes above Supertrend Its bullish Momentum when its below Supertrend its Bearish Momentum. This indicator scans for candle closes on the current chart and when there is a shift in momentum (price closes below or above SUPERTREND) it notifies the trader with a Bar Color change.
Technical Inputs
- If you want to optimize the rate of signals to better fit your trading plan you would change the Factor input and ATR Length input. Increase factor and ATR Length to decrease the frequency of signals and decrease the Factor and ATR Length to increase the frequency of signals.
Quick TIP! : You can Sync all VFX SuperTrend Indicators together! All VFX SuperTrend indicators display unique information but its all derived from that same Momentum Formula. Keep the Factor input and ATR Length the same on other VFX SuperTrend indicators to have them operating on the same data.
Display Inputs
- The indicator has a candle overlay option you can toggle ON or OFF. If toggled ON the candles color will represent the momentum of your current chart ( bullish or bearish Momentum)
your able to change the colors that represent bullish or bearish to your preference
- You can toggle on which shows the exact candle momentum switched sides
your able to change the colors that represent a bullish switch or bearish switch to your preference
- The trader can specify which point you would like your stop loss to reference. (Low and High) Which uses the Low of the Momentum signal as the reference for your Stop Loss during buy signals and the High as the reference during sell signals. Or (Lowest Close and Highest Close) which uses the Lowest Close of the Momentum signal as the reference for your Stop Loss during buys and the Highest Close as the reference during sells.
- The colors that represent your Stop Loses and Take Profits can also be changed
Risk Management Inputs
- Your Risk MANAGMENT section is used to set up how your Stop Loss and Take Profit are calculated
- You have the option to take in account Volatility when calculating your Stop Loss. A adjusted ATR formula is used to achieve this. Increase Stop Loss Multiplier from 0 to widen stops.
- Increase Take Profit Multiplier from 0 to access visual Take Profit Levels based on your Stop Loss. This will be important for traders that Prefer trading using risk rewards. For Example: If the the Take Profit Multiplier is 3 a Take Profit level 3 times the size or your stop loss from your entry will be shown and a price number corresponding to that Take Profit Level becomes available.
- Enter your current Account size, Bet Percentage and Fixed Spread to get your Position Size for each trade
-Toggle on the Current Trade Chart and easily get the size of your Position and the exact price of your Take Profit and Stop Loss.
You can increase the Size of the Current Trade Chart= Tiny, Small, Normal, Large, Huge and change the Position of the Current
trade Chart to your preference, (Top- Right, Center, Left) (Middle- Right, Center, Left) (Bottom- Right, Center, Left).
How it can be used ?
- Enter Trades and always know where your stop is going to be
- Eliminate the need to manual calculate Position Size
- Get a consistent view of the current charts momentum
- Systematical enter trades
- Reduce information overload

SSL + Wave Trend StrategyStrategy incorporates the following features:
Risk management:
Configurable X% loss per stop loss
Configurable R:R ratio
Trade entry:
Based on strategy conditions below
Trade exit:
Based on strategy conditions below
Backtesting:
Configurable backtesting range by date
Trade drawings:
Each entry condition indicator can be turned on and off
TP/SL boxes drawn for all trades. Can be turned on and off
Trade exit information labels. Can be turned on and off
NOTE: Trade drawings will only be applicable when using overlay strategies
Alerting:
Alerts on LONG and SHORT trade entries
Debugging:
Includes section with useful debugging techniques
Strategy conditions
Trade entry:
LONG
C1: SSL Hybrid baseline is BLUE
C2: SSL Channel crosses up (green above red)
C3: Wave Trend crosses up (represented by pink candle body)
C4: Entry candle height is not greater than configured threshold
C5: Entry candle is inside Keltner Channel (wicks or body depending on configuration)
C6: Take Profit target does not touch EMA (represents resistance)
SHORT
C1: SSL Hybrid baseline is RED
C2: SSL Channel crosses down (red above green)
C3: Wave Trend crosses down (represented by orange candle body)
C4: Entry candle height is not greater than configured threshold
C5: Entry candle is inside Keltner Channel (wicks or body depending on configuration)
C6: Take Profit target does not touch EMA (represents support)
Trade exit:
Stop Loss: Size configurable with NNFX ATR multiplier
Take Profit: Calculated from Stop Loss using R:R ratio
Credits
Strategy is based on the YouTube video "This Unique Strategy Made 47% Profit in 2.5 Months " by TradeSmart.
It combines the following indicators to determine trade entry/exit conditions:
Wave Trend: Indicator: WaveTrend Oscillator by @LazyBear
SSL Channel: SSL channel by @ErwinBeckers
SSL Hybrid: SSL Hybrid by @Mihkel00
Keltner Channels: Keltner Channels Bands by @ceyhun
Candle Height: Candle Height in Percentage - Columns by @FreeReveller
NNFX ATR: NNFX ATR by @sueun123

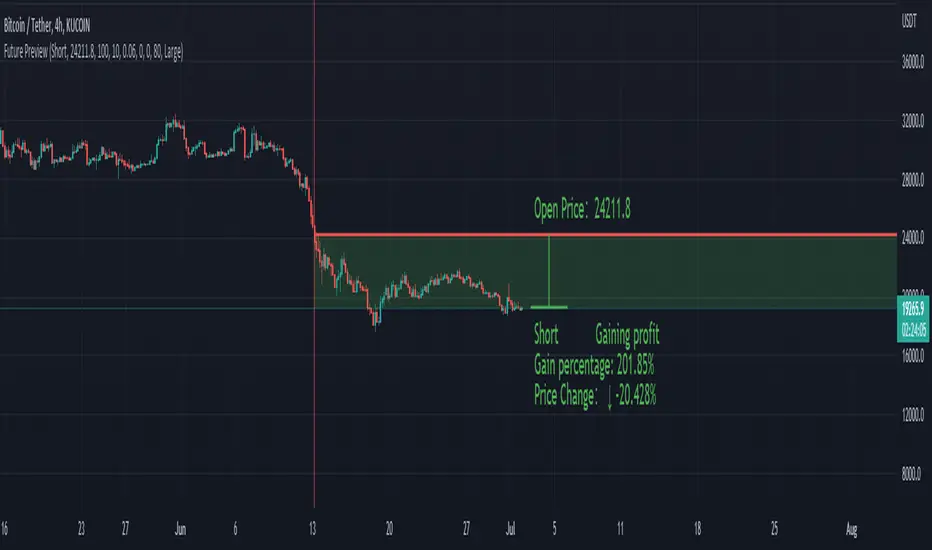
Future PreviewFuture Preview
Calculate real-time future order profit with open price, leverage and commission fee. Simple and straight forward. If you need any additional feature, please leave a comment below. I am glad to help.
Usage:
When adding Future Preview to chart, it will ask order open time and open price on the chart by clicking with left mouse on the desired value. These value can be changed lately, as well as the leverage and commission fee. Default leverage is 10 and default commission fee is 0.06% (taker).
There will be two horizontal lines. The solid longer line is the open price line, it shows the order open price. The shorter line moving with real-time price is the current price line, it shows the current price. There will be preview data shows on top or below the price line. Open price line is red for short order and green for long order. The current price line is red when the order is losing and it is green when it profiting. The back ground color follows the color of current price line. Background color transparency and gain/loss color can be changed in options.
There will be one horizontal line on the left if the option of showing open time is on (default is on). It shows the time stamp when current order opened.
After adding Future Preview to chart, there is option to add Taking Profit(TP) or Stop Loss(SL) to the chart.
Font size can be changed in option
MPF EMA Cross Strategy (8~13~21) by Market Pip FactoryThis script is for a complete strategy to win maximum profit on trades whilst keeping losses at a minimum, using sound risk management at no greater than 1.5%
The 3x EMA Strategy uses the following parameters for trade activation and closure.
1/ Daily Time Frame for trend confirmation
2/ 4 Hourly Time Frame for trend confirmation
3/ 1 Hourly Time Frame for trend confirmation AND trade execution
4/ 3x EMAs (Exponential Moving Averages)
* EMA#1 = 8 EMA (Red Color)
* EMA#2 = 13 EMA (Blue Color)
* EMA#3 = 21 EMA (Orange Color)
5/ Fanning of all 3x EMAs and CrossOver/CrossUnder for Trend Confirmation
6/ Price Action touching an 8 EMA for trade activation
7/ Price Action touching a 21 EMA for trade cancellation BEFORE activation
* For LONG trades: 8 EMA would be ABOVE 21 EMA
* For SHORT trades: 8 EMA would be BELOW 21 EMA
* For trade Cancellation, price action would touch the 21 EMA before trade is activated
* For trade Entry, price action would touch 8 EMA
Once trigger parameter is identified, entry is found by:
a) Price action touches 8 EMA (Candle must Close for confirmed Trade preparation)
b) Trade preparation can be cancelled before trade is activated if price action touches 21 EMA
c) Trailing Stop Loss can be used (optional) by counting back 5 candles from current candle
CLOSURE of a Trade is identified by:
e) 8 EMA crossing the 21 EMA, then close trade, no matter LONG or SHORT
f) Trail Stop Loss
IMPORTANT:
g) No more than ONE activated trade per EMA crossover
h) No more than ONE active trade per pair
NOTE: This strategy is to be used in conjunction with Cipher Twister (my other indicator) to reduce trades on
sideways price action and market trends for super high win ratio.
NOTE: Enabling of LONGs and SHORTs Via Cipher Twister is done by using the previous
green or red dot made. Additionally, when the trend changes, so do the dot's validity based
on being above or below the 0 centerline.
----------------------------
Strategy and Bot Logic
----------------------------
.....::: FOR SHORT TRADES ONLY :::.....
The Robot must use the following logic to enable and activate the SHORT trades:
Parameters:
$(crossunder)=8EMA,21EMA=Bearish $(crossover)=8EMA,21EMA=Bullish $entry=SELL STOP ORDER (Short)
$EMA#1 = 8 EMA (Red Color) $EMA#2 = 13 EMA (Blue Color) $EMA#3 = 21 EMA (Orange Color)
Strategy Logic:
1/ Check Daily Time Frame for trend confirmation if:
(look back up to 50 candles - find last cross of EMAs)
$(chart)=daily and trend=$(crossunder) then goto 2/ *Means: crossunder = ema21 > ema8
$(chart)=daily and trend=$(crossover) then stop (No trades) *Means: crossover = ema8 > ema21
NOTE: This function is switchable. 0=off and 1=on(active). Default = 1 (on)
2/ Check 4 Hourly Time Frame for trend confirmation if:
(look back up to 50 candles - find last cross of EMAs)
$(chart)=4H and trend=$(crossunder) then goto 3/ *Means: crossunder = ema21 > ema8
$(chart)=4H and trend=$(crossover) then stop (No trades) *Means: crossover = ema8 > ema21
NOTE: This function is switchable. 0=off and 1=on(active). Default = 1 (on)
3/ 1 Hourly Time Frame for trend confirmation AND trade execution if:
(look back up to 50 candles - find last cross of EMAs)
$(chart)=1H and trend=$(crossunder) then goto 4/ *Means: crossunder = ema21 > ema8
$(chart)=1H and trend=$(crossover) then stop (No trades) *Means: crossover = ema8 > ema21
4/ Trade preparation:
* if Next (subsequent) candle touches 8EMA, then set STOP LOSS and ENTRY
* $stoploss=3 pips ABOVE current candle HIGH
* $entry=3 pips BELOW current candle LOW
5/ Trade waiting (ONLY BEFORE entry is hit and trade activated):
* if price action touches 21 EMA then cancel trade and goto 1/
Note: Once trade is active this function does not apply !
6/ Trade Activation:
* if price activates/hits ENTRY price, then bot activates trade SHORTs market
7/ Optional Trailing stop:
* if active, then trailing stop 3 pips ABOVE previous HIGH of previous 5th candle
or * Move Stop Loss to Break Even after $X number of pips
NOTE: This means count back and apply accordingly to the 5th previous candle from current candle.
NOTE: This function is switchable. 0=off and 1=on(active). Default = 0 (off)
8/ Trade Close ~ Take Profit:
* Only TP when
$(chart)=1H and trend=$(crossover) then close trade ~ Or obviously if Stop Loss is hit if 7/ is activated.
----------END FOR SHORT TRADES LOGIC----------
.....::: FOR LONG TRADES ONLY :::.....
The Robot must use the following logic to enable and activate the LONG trades:
Parameters:
$(crossunder)=8EMA,21EMA=Bearish $(crossover)=8EMA,21EMA=Bullish $entry=BUY STOP ORDER (Long)
$EMA#1 = 8 EMA (Red Color) $EMA#2 = 13 EMA (Blue Color) $EMA#3 = 21 EMA (Orange Color)
Strategy Logic:
1/ Check Daily Time Frame for trend confirmation if:
(look back up to 50 candles - find last cross of EMAs)
$(chart)=daily and trend=$(crossover) then goto 2/ *Means: crossover = ema8 > ema21
$(chart)=daily and trend=$(crossunder) then stop (No trades) *Means: crossunder = ema21 > ema8
NOTE: This function is switchable. 0=off and 1=on(active). Default = 1 (on)
2/ Check 4 Hourly Time Frame for trend confirmation if:
(look back up to 50 candles - find last cross of EMAs)
$(chart)=4H and trend=$(crossover) then goto 3/ *Means: crossover = ema8 > ema21
$(chart)=4H and trend=$(crossunder) then stop (No trades) *Means: crossunder = ema21 > ema8
NOTE: This function is switchable. 0=off and 1=on(active). Default = 1 (on)
3/ 1 Hourly Time Frame for trend confirmation AND trade execution if:
(look back up to 50 candles - find last cross of EMAs)
$(chart)=1H and trend=$(crossover) then goto 4/ *Means: crossover = ema8 > ema21
$(chart)=1H and trend=$(crossunder) then stop (No trades) *Means: crossunder = ema21 > ema8
4/ Trade preparation:
* if Next (subsequent) candle touches 8EMA, then set STOP LOSS and ENTRY
* $stoploss=3 pips BELOW current candle LOW
* $entry=3 pips ABOVE current candle HIGH
5/ Trade waiting (ONLY BEFORE entry is hit and trade activated):
* if price action touches 21 EMA then cancel trade and goto 1/
Note: Once trade is active this function does not apply !
6/ Trade Activation:
* if price activates/hits ENTRY price, then bot activates trade LONGs market
7/ Optional Trailing stop:
* if active, then trailing stop 3 pips BELOW previous LOW of previous 5th candle
or * Move Stop Loss to Break Even after $X number of pips
NOTE: This means count back and apply accordingly to the 5th previous candle from current candle.
NOTE: This function is switchable. 0=off and 1=on(active). Default = 0 (off)
8/ Trade Close ~ Take Profit:
* Only TP when
$(chart)=1H and trend=$(crossunder) then close trade ~ Or obviously if Stop Loss is hit if 7/ is activated.
----------END FOR LONG TRADES LOGIC----------
IMPORTANT:
* If an existing trade is already open for that same pair, & price action touches 8EMA, do NOT open a new trade..
* bot must continuously check if a trade is currently open on the pair that triggers
* New trades are to be only opened if there is no active trade opened on current pair.
* Only 1 trade per pair rule !
* 5 simultaneous open trades (not same pairs) default = 5 but value can be changed accordingly.
* Maximum risk management must not exceed 1.5% on lot size
*** Some features are not yet available autoated, they will be added in due course in subsequent version updates ***

Ranged Volume DCA Strategy - R3c0nTraderUpdate: Republishing this as Public Open-Source script.
Credits:
Thank you "EvoCrypto" for granting me permission to use "Ranged Volume" to create this strategy.
Thank you "junyou0424" for granting me permission to use "DCA Bot with SuperTrend Emulator" which I used for adding bot inputs, calculations, and strategy
What does this do?
This script is mainly used for backtesting a Ranged Volume strategy to see how a 3Commas bot would perform.
I created this script out of necessity and I wanted a way to test a 3Commas DCA bot with a strategy based on “Volume.”
I came across "EvoCrypto’s" "Ranged Volume" study and strategy in TradingView and I liked it. I wanted to configure it so it can be used for DCA bot backtesting. I used parts from "junyou0424’s" "DCA Bot with SuperTrend Emulator" to add the following:
1. The Start Time and End Time
2. Price deviation to open safety orders (%)
3. Target Take Profit (%)
4. Trailing deviation
5. Base Order and Safety Order
6. Safety order volume scale
7. Safety order step scale
8. Max safety orders
In addition to the above, I also added chart indicators for "Take Profit" as well as "Safety Order"
Pre-requisites:
You can use this script without a 3Commas account and see how 3Commas DCA Bot and Ranged Volume strategy would perform vs. a non-DCA strategy. However, I highly recommend signing up for their free account and going through their training. This would give you a base understanding on the settings you will see in this strategy and why you will need to know them.
That said these are the pre-requisites I suggest you have:
1. Base Knowledge of 3Commas DCA bots
2. Base knowledge of settings such as “Max safety trades count”, “safety order volume scale” and “safety order step scale”. If these are alien to you, I suggest you read up on these.
3. Knowledge of setting up a Single-pair 3Commas bot for receiving custom TradingView signal.
4. A paper-bot to test your ideas. (Do not use a real money bot until you have tested it sufficiently with a paper-bot. You alone are responsible for your results!)
5. Add the study I created called "R3c0nTrader’s Ranged Volume Study” which adds a separate chart in its own pane showing the volume spikes. It will also generate the “buy” signals for your bot. NOTE: The study also has the same color scheme as this strategy and having the colors in both the strategy and the study will make things easier to see. If you use EvoCrypto’s Ranged Volume Study instead, just keep in mind that the colors won’t match, and you will have to manually match them.
6. Make your buy signals from your strategy are the same as in your study! To do this, use the same “Volume Range Length” you entered in the STRATEGY and enter that value for the “Volume Range Length” in the STUDY. Also ensure you have the same settings for “Heikin Ashi” (On or Off).
Comparisons of Ranged Volume Strategy vs Ranged Volume DCA Strategy
BTCUSD
Beware of Strategies that claim super high profits. This can easily be done by lowering the initial capital to something unrealistic. If I did that with this strategy and set the initial capital $100 and base order size to $100, I get a net profit of 2,864% which is not realistic.
How to Use
1. On the “Inputs” tab:
a. Set your Start and End Time to backtest against.
b. Set your “Volume Range Length” (number of bars to look back)
c. “Heikin Ashi Colors” – Usually I leave this enabled
d. “Show Bar Colors” – Leave enabled
e. “Show Break-Out” – Leave enabled
f. “Show Range” – Leave enabled
g. Set your other inputs which are those settings you would find in your 3Commas bot that you want to test (e.g., Price deviation to open safety orders, Target Take Profit, Base order, Safety order, etc.).
h. Quick Example for BTCUSD on 2hr chart:
i. Price deviation to open safety orders (%) = 6
ii. Target Take Profit (%) = 14
iii. Trailing deviation = 0
iv. Base order = 100
v. Safety order = 200
vi. Safety order volume scale = 2
vii. Safety order step scale = 1.4
viii. Max safety order = 5
2. On the “Properties” tab, set your initial capital, base currency, etc.
a. Initial capital – Default is 10,000 (Please use realistic values here. The amount here should be able to cover ALL your safety orders if they were triggered. Ideally, you should have funds left over and not use all trade capital.)
b. Base currency – Select your currency
c. Order Size - Not used. Use the “Inputs” tab to change your base order size.
d. Leave “Pyramiding” set to 999. This acts as a ceiling to the “Max safety orders” on the “Inputs” tab. It must always be higher than your “Max safety orders.” For example, if you set your “Max safety orders” to “4” and “Pyramiding” to “4” then it effectively means you have “3” “Max safety orders” and not “4” because it is counting each successive entry including the initial order.
e. “Commission” - Optional
f. “Verify price for limit orders” – Leave at zero. This does not change anything that I can tell.
g. Optional - Enter a value for “Commission”
h. Slippage – Optional. Slippage does not occur in backtesting but does occur in real trading but it can be simulated. Example use case for tracking performance of a real money bot: You enter the start date and time of your bot’s trade into this strategy and you notice some values are a little off due to slippage (average price, take profit, safety orders are not lining up) then you would go back here and increase the slippage until those lines up close enough with your actuals.
i. Margin for long positions – I don’t use this honestly.
j. Margin for short positions – I don’t use this honestly.
k. Recalculate “After order is filled” and “On every tick” – I don’t use this honestly.
3. “Style” tab
a. Ranged Volume Bar Coloring - You must disable bar coloring in any studies you added or this may not work properly
i. Color 0 – Default Yellow; appears when a volume breakout occurs
ii. Color 1 – Default Red; appears when a volume breakdown occurs
iii. Color 2 – Light Blue; appears when Close is higher than the Open
iv. Color 3 – Dark Blue; appears when the Close is lower than the Open
b. Take profit – Default Green; take profit line
c. Safety order – Default Light Blue; safety order line
d. No Safety Orders left – Default Red; when a trade runs out of safety orders, the line turns red and there is no safety orders left underneath to catch any further falling price movements.
e. Avg Position Price – Default Orange; your average position price for any given trade.
f. Take Profit Plot Area – Default Green; creates a highlighted area for your take profit
g. SO Plot Area – Default Light Blue; creates a highlighted area for your safety orders
h. Trades on chart – Show or hide your trades on the chart
i. Signal labels – Show or hide the trade signal labels on the chart
j. Quantity – Show or hide the trade quantity on the chart
Explanation of Chart lines and colors on chart

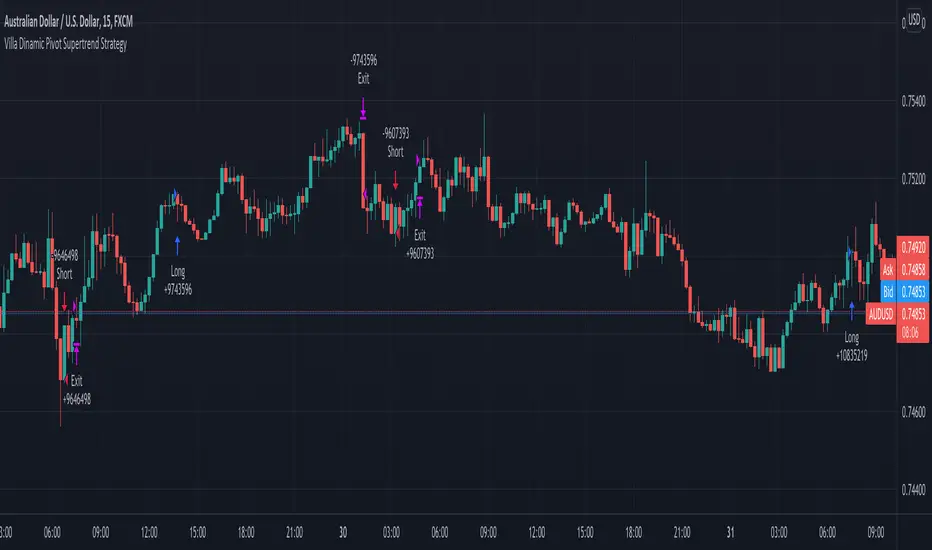
Villa Dinamic Pivot Supertrend StrategyThis strategy works better on AUD/USD in the 15 min timeframe. It uses the Pivot Supertrend to enter trades based on different filters such as:
- Simple EMA filter: that the 3 EMAs should be in order
- DEMA angle: you can choose the DEMA Angle threshold and the look back to check the angle to just trade trades with DEMA at a certain angle
- Simple DEMA filter: just check if close is above or below DEMA
- Take Every Supertrend Signal: this means to take every normal supertrend signal to not just wait for a pivot supertrend signal to enter a trade (specially on long pivot supertrend periods)
- Stop Loss at Supertrend: this means that the stop loss will be at the Normal Supertrend, if false the stop loss will be placed at the ATR level selected.
- 2 Steps Take Profit: this means if you want to close a percentage of position as soon as the normal supertrend crosses the entry price, you can select the % on the "2 Steps TP qty" input
- Stop Loss ATR Multiplier: if Stop Loss at Supertrend is off this will be the stoploss based on the atr
- Take Profit ATR Multiplier: if Stop Loss at Supertrend is off this will be the takeprofit based on the atr (you have to keep in mind that the ratio between this two will make the Risk to reward ratio of the take profit when the Stop Loss at Supertrend)
- Testing: to avoid overfitting, you can select date ranges for backtesting and forwardtesting and select which testing you wanna do
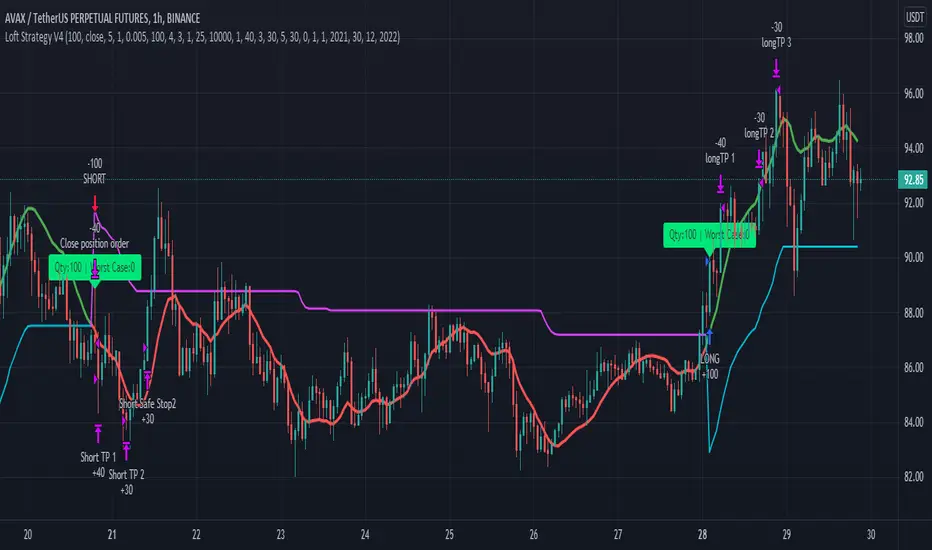
Loft Strategy V4This strategy is an advanced version of the Loft Strategy V1, I shared earlier. (Loft Strategy V1 consists of a kalman filter (by alexgrover ) and a "stop and reverse" line which is following and the kalman filter. If the price goes in the same direction as the position side, the "stop and reverse" line approaches the kalman filter as set on the "Approach Decrease Step" parameter.)
In addition to the previous version, it includes a martingale like deviation and multiple take-profit.
Here it is some parameters definitions of the strategy:
Kalman Filter: The higher this parameter, the faster and more aggressive the filter. Otherwise the filter goes very smoothly
Beginning Approach: First approximation as a percentage of stop-n-reverse line
Final Approach: Minimum approximation of stop-n-reverse line
Approach Decrease Step: If the price moves in the same direction as the strategy, the approach percentage is reduced by this parameter. Otherwise nothing do
Base Order Quantity: Initial capital of position
Max Safe Order Attempt: This parameter determines the maximum number of times the strategy will raise the bet after losing in a row.
Safe Order Deviation: if the last trade is loss, multiply the bet by this parameter (aka. martingale factor)
Profit Deviation: if last trade in loss, multiply the take-profit points
Max Order Quantity: Maximum capital allowed for a position
TP1, TP2, TP3 : Take profit spots in percentage
QT1, QT2, QT3: Amount of take-profit spots
Stop Loss: Maximum stop loss allowed for a trade
Long Entry, Short Entry: Only long side, only short side or both side
Safe Stop After TP2: If the price reaches the TP2 point, move the stop-loss point to the entry price.
Safe Stop After TP1: If the price reaches TP1, move the stop-loss point to the stop-n-reverse line.
PVSRA Volume Price - Some people say "Price Action is King". I say, we cannot know how the MMs (Market Makers) will move price next, period. But price tends to consolidate above key SR when MMs are filling short orders for SM (Smart Money) and long orders for DM (Dumb Money), and price tends to consolidate below key SR when MMs are filling long orders for SM and short orders for DM. The MMs are also "SM", and they tend to do the other SMs "one better"! This means that after the MMs fill the SM/DM orders, they might move price a bit further in an attempt to stop out some of those SM executed orders and sucker in more DM; both giving liquidity for the MMs to add to their own SM side position. Yes, the MMs are bastards. But the point is that could leave price not "nicely" above or below a SR anymore, yet more consolidation can occur.
Volume - Increases in activity denote increase in interest. But, is it long or short interest? Where is price in the bigger picture when this is happening? Is it at relative highs, or lows in the overall price action? And if a high volume bar is for a candle which you can examine by going to lower TF charts, you might see where in the spread of that candle the most volume occurred, high or low! Using volume is about taking note of relative increases in volume and what price is doing at the same time. Are the better volumes favoring the lower or the higher prices, as the MMs waffle price up and down? And do the volumes get particularly notable when the MMs take price above or below key SR?
S&R - Read all about S&R at "Baby Pips.com". What I want you to realize here is that the whole, half and quarter numbered price levels (hereinafter referred to as "Levels") are the most important SR of all in this market! Not because price stops, pauses, proceeds or reverses there, but because it is above or below these levels that important consolidation (MMs filling SM orders) takes place. Once SM long orders are filled, they become interested in placing orders to close them at higher prices, and hence the MMs will be moving price higher, eventually. Once SM short orders are filled, they become interested in placing orders to close them at lower prices, and hence the MMs will be moving price lower, eventually.
PVSRA - If we can spot consolidations above/below key SR, examine the overall price action on various TF charts, and take note of where the notable increases in volume have most recently occurred (did volume favor relative highs or lows), then we can build a consensus about what kind of orders the MMs have most recently been filling; buying to open longs or close shorts, or selling to open shorts or close longs. And we can get a better idea if things will next become bullish or bearish. And once PA confirms our bullish or bearish PVSRA results, by recognizing the importance of Levels we can look beyond current PA in the direction it is going and look to historic PA S&R (consolidation around key Levels) to come up with candidates for where the price might be headed. And bull or bear swings typically run in terms of 100+, 150+, 200+ pips, .....etc. And now you know why.
Okay. Now, if this is your first introduction to PVSRA, and having just read the above, you are likely scratching your head and still confused. That is normal. I will tell you a secret about the market and why you have a right to be confused. The secret is this. The market cannot be defined by mathematics nor by immutable logic. This is why the most advanced mathematicians over a century have never even come close to cracking the market. It cannot be done. Something else, other than math and immutable logic is the fundamental operand in the market. Have you ever watched a child attempt a jigsaw puzzle for the first time? And watched as that child grew and attempted more of them, and more complex ones? What is at work in the market I will elaborate on later, but for now trust me in this. We need to apply ourselves to learning how to do PVSRA just as a child attacks learning how to do jigsaw puzzles. And we must continue doing PVSRA, because in time our mind will "learn" when we have just picked up an important piece of the puzzle, and that we know where it goes! Developing the skill of PVSRA is an art form. We must not allow ourselves to feel badly if we miss clues. PVSRA is an art form that takes time to perfect. Over time our skill will grow and our "read" of the unpredictable market will improve. We must take to ongoing learning and application of PVSRA.
Introduction to How the Market Really Works
Does anybody remember the "lil' Abner" cartoons in the Sunday papers? Let me draw for you a mental picture of how the market really works.....
Imagine Daddy Yokum ferociously racing a buckboard wagon up and down the steep inclines and declines in the rough, rocky mountain road that has sharp turns and a sheer cliff on one side. The wagon wheels are spewing rocks off the side of the cliff! Even Daddy Yokum's shotgun is going off due to the jolting of the buckboard! Daddy Yokum has a demented look on his face, but he is smiling! The horse has a wild look in it's eyes and is frothing at the mouth. There are two passengers being tossed around in the back of the buckboard, terror stricken! Now, let's pan back from this cartoon picture and place the labels needed. On the side of the wagon is the sign "Market Pricing". The demented, smiling Daddy Yokum, is the Market Maker. The passengers being tossed around are the buyers and sellers.
.....Got it? Market prices are not determined by the buyers and sellers. They are determined by the Robber Bank Market Makers (MMs).
MMs are Market Manipulators of Price, and Thieves!
The "market" is the sole creation of the Robber Banks that "make the market". While it serves the world of commerce, they run it to make profits. And they opened the market up to foster prolific currency trading by others for the sole purpose of making more profits. They move prices up and down to "create liquidity" to fill the orders of SM (Smart Money) and DM (Dumb Money), for the commissions they make by filling the orders. When they have some orders above the current price and some below the current price, who do you think determines the sequence of direction and distance the price is going to move so these orders can be filled? And always - since they know how they are going to move price next - they take positions themselves to make additional profits.
They do this by:
1. Manipulating price to sucker into the market DM that is taking the wrong side position.
2. Manipulating price to sucker into the market SM that is taking the right side position, but too soon, and later manipulating price to hit their stops.
They have total control of pricing, and by these actions they effectively "steal" from others the money to fill their own "right side" positions before moving the price to the next area they have decided on for filling orders, and for taking profit on their positions built beforehand. Don't get me wrong. I do not object to the market volatility these thieving Robber Banks create. We need it. But we also need to understand what these people are like, the cloth they are cut from. They are crooks, and we have to be extra careful about trading in the market they operate. On some special days you can see them in their true colors. We should witness it. Take note of it. Speak of it. And remember it!

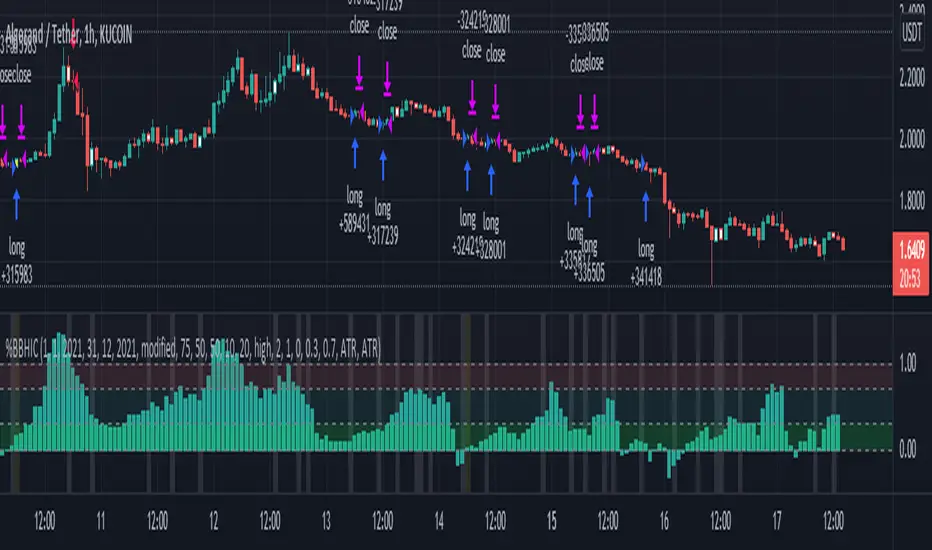
Volume Based Ichimoku CloudIntroduction
This release focuses primarily on a volume-based Donchian. For some time I was looking for a volume-based Donchian, not finding anything that satisfied me I tried to apply one, and then I applied it to Ichimoku.
I found advantages especially in the lateralization phase, where the integration with the volume filters some false signals.
I have added some features:
- Check the conditions of buy/sell of classic Ichimoku
- Verified reverse buy/sell condition
- Alerts
- Entrance package
- possibility to choose the type of Donchian to use (classic, volume-based)
Settings
There are the classic parameters of Ichimoku, for scalping, I use setting like(6-17-34-17 or 5-14-28-14), the new parameters are:
Donchian Type : Classic / Volume Based
Show Condition : it shows green/red square on the bottom when all the conditions of Ichimoku are satisfied, without the checkmark the inputs or the alarms will not work for this type of signal
Show Reversal : it shows yellow/purple triangle on the bottom when all during short/long state condition of Ichimoku Tenkan cross the Kijun, without the checkmark the inputs or the alarms will not work for this type of signal
Trades Framework
Show Trade Lines : show the lines for Entry Point, TP1, TP2, SL
Per n Bars : For how many bars the sending lines will be drawn
Enter Gap : It's the gap, in percentage, from the last candle low/high. For example, the entry point will be set 0.1% higher than the last high of the candle, in a long situation, or 0.1% lower than the last low of the candle in a short situation.
Take Profit 1 : It's the gap, in percentage, from the entry point. For example, the first take profit will be set 0.5% higher/lower than the entry point.
Take Profit 2 : It's the gap, in percentage, from the entry point. For example, the second take profit will be set 0.5% higher/lower than the entry point.
Stop Loss : It's the gap, in percentage, from the entry point. For example, the stop loss will be set 0.5% higher/lower than the entry point.
How to use
The use will be like that for the classic Ichimoku, the combination with a volatility indicator or the volume analysis will certainly help to reduce false signals and therefore to select only the most profitable signals.
Remember that every statistical indicator is just a tool, it needs to be understood to be used at its best, otherwise, it is just a colored line in a colored graph.

Bollinger Bands %B - Belt Holds & Inner CandlesThis is a simple strategy that uses Bollinger Bands %B represented as a histogram combined with Candle Beltholds and Inside candles for entry signals, and combines this with "buy" and "sell" zones of the %B indicator, to buy and sell based on the zones you set.
How to use:
Long when in the green zone and an inside candle (which is highlighted in white) or a bullish belt hold (which is highlighted in yellow), and sell when inside a red zone and has an inside candle or a bearish belt hold (which is highlighted in purple) or the stop loss or take profit is hit.
Short when in the red zone and an inside candle (which is highlighted in white) or a bearish belt hold (which is highlighted in purple), and sell when inside a green zone and has an inside candle or a bullish belt hold (which is highlighted in yellow) or the stop loss or take profit is hit.
Stop loss / take profit selection:
Choose which performs best for you, ATR based uses the average true range, and % based is based on a set percent of loss or profit.
DI Crossing Daily Straregy HulkTradingSimple strategy based on crossing DI+ and DI- and Average True Range.
Long entry when DI+ crossover DI-
Short entry when DI+ crossunder DI-
Stop Loss and Take Profits based on Average True Range.
Default values are 1*ATR(14) for stop loss and 2*ATR(14) for Take Profit.
Risk reward 1 to 2 ratio.
Recommended default values, but you can change it if you want.
Recommended timeframe - 1D.
Script was tested on BTCUSDT pair and have a 2.4 profit factor.

Data Trader Stoch | RSI | MACD Strategy IndicatorImplementation of Data Trader's strategy, described in the youtube video, "Highly Profitable Stochastic + RSI + MACD Trading Strategy (Proven 100x)"
Also see Algovibes' video, "Highly Profitable Stochastic + RSI + MACD Trading Strategy? Testing Data Traders strategy in Python"
Note: Despite the claims, it generates barely, if any, signals, certainly in the crypto markets
If there are any mistakes, give feedback in the comments, and I'll fix
### Strategy Summary ###
# Long Signals #
Stoch K and D are oversold
RSI above midline
MACD above signal line
# Short Signals #
Stoch K and D are overbought
RSI below midline
MACD below signal line
# Stop loss and Take Profit #
Stop loss
Longs: below last swing low
Shorts: above last swing high
Take profit at 1.5x stop loss
Mid to High daily % - MA & ThresholdPurpose of this script is to provide a metric for comparing crypto volatility in terms of the % gain that can be garnished if you buy the midpoint price of the day and sell the high***. I'm specifically using bots that buy non-stop. This metric makes it easy to compare crypto coins while also providing insight on what a take profit % should be if I want to be sure it closes often instead of getting stuck in a position.
Added a few moving averages of (Mid-range to High Daily %). When these lines starts to trend down, it's time to lower the take profit % or move on to the next coin.
Decided to add a threshold so I could easily mark where I think the (Mid-range to High Daily %) is for most days.
Ex. I can mark 10% threshold and can eyeball roughly ~75% of the days in the past month or so were at or above that level. Then I know I have plenty volatility for a bot taking 5% profit. Also if you have plenty of periodic poke-through that month (let's say once a week) you might argue that you can set it to 7% if you're willing to wait about that long. Either way this metric is conservative because it is only the middle of the range to the high, a less conservative version might provide the % gain if you bought the day low and sold the day high.
***Since this calculation only takes the middle of the range and the high of the day into account, red days are volatile against a buyer but to your advantage if you are a seller. BUT if you have plenty of safety buy orders this volatility in price only means your total purchase volume increases and when/if you reach a take profit level you sell more there.
Would like to upgrade and add a separate MA line for green days and a separate MA line for red days to discern if that particular coin has a bias. Also would like to include some statistics on how many candles are above or below threshold for a certain period instead of eyeballing.

SQZ Multiframe StrategyThis is a first attempt to automate what my current strategy when trading is.
It uses 2 timeframes: the one you are currently using to see the chart and an "anchor trend" which is a higher order frame.
Supported timeframes are: 1m, 5m, 15m, 30m, 1H, 4H, 1D, 1W
The Strategy relies on two indicators:
Squeeze Momentum Indicator
CMF
How does it works?
It looks for a moment when the following conditions are met.
For Long:
Positive directionality in SQZM monitor in anchor timeframe
Positive directionality in SQZM monitor in current timeframe
Recent minimum in CMF
For Short:
Negative directionality in SQZM monitor in anchor timeframe
Negative directionality in SQZM monitor in current timeframe
Recent maximum in CMF
After a BUY or SELL order is executed the plot will start showing two lines: A TP line, and a SL line.
The TP and SL move dynamically based on a greedy algorithm based on 3 input parameters.
Min Profit to Start Moving SL (%): Sets an initial target for the trade.
Maximum Possible of SL (%): This is the maximum amount possible for SL. If volatility is not too high, a shorter SL will be chosen based on Kaufman's Stops method
Take profit factor: Is how much portion of the target I am taking as profit once the target is reached
Example for 5% Min profit:
When the first target is reached (+5%), the SL will be updated to 2.5% over the enter price.
When the second target is reached (+10%), the SL will be updated to 5% over the enter price.
Note: The strategy might abandon the position prematurely if a contrary signal is received while the trade is opened, and will change direction.
The Strategy has been backtested mostly for crypto. It might be good for stocks too, but the parameters mentioned might need some adjustments since price moves at a different rate.
Recommended timeframe is 4H for BTC , and 30min/1H for alts.
Comments and ideas are more than welcome!

Strategy Template - V2This is an educational script created to demonstrate few basic building blocks of a trend based strategy and how to achieve different entry and exit types. My initial intention was to create a comprehensive strategy template which covers all the aspects of strategy. But, ended up creating fully fledged strategy based on trend following.
This is an enhancement on Strategy-Template But this script is comparitively more complex. Hence I decided to create new version instead of updating the existing one.
Lets dive deep.
SIMPLE COMPONENTS OF TREND FOLLOWING STRATEGY
TREND BIAS - This defines the direction of trend. Idea is not to trade against the trend direction. If the bias is bullish, look for long opportunities and if bias is bearish, look for short opportunities. Stay out of the market when the bias is neutral.
Often, trend bias is determined based on longer timeframe conditions. Example - 200 Moving Average, Higher timeframe moving averages, Higher timeframe high-lows etc. can be used for determining the trend bias.
In this script, I am using Weekly donchian channels combined with daily donchian channels to define trend bias.
Long Bias - 40 Day donchian channel sits completely in upper portion of 40 Week dochnial channel.
Short Bias - 40 Day donchian channel sits completely in lower portion of 40 Week donchian channel.
ENTRY CONDITION - Entry signals are generated only in the direction of bias. Hence, when in LongBias, we only get Long signals and when in short bias, we only get short signals.
In our case, when in Long Bias - if price hits 40 day high for the first time, this creates our long entry signal. Similarly when in Short Bias , price hitting 40 day low will create signal for going short. Since we do not take trades opposite to trend, no entry conditions are formed when price hits 40 day high in Short Bias or 40 day low in Long Bias.
EXIT CONDITION - Exit conditions are formed when we get signals of trend failure.
In our case, when in long trade, price hitting 40 day low creates exit signal. Similarly when in short trade price hitting 40 day high creates exit signal for short trade.
DIFFERENT TYPES OF ENTRY AND EXIT
In this script, I have tried to demonstrate different entry and exit types.
Entry types
Market - Enter immediately when entry signal is received. That is, in this case when price crossover over high in long bias and crosses under low in short bias
Stop - This method includes estimating at what level new highs are made and creating a stop buy order at that level. This way, we do not miss if the break out is stronger. But, susciptible to fail during fakeouts.
Limit - This method includes executing a limit order to buy at lower price or sell at higher price. In trend following methods, downside of limit order is when there is genuine breakout, these limit orders may not hit and during trend failures the limit orders are likely to hit and go straight to stop.
Stop-Limit - this is same as stop order but will also place a limit condition to avoid buying on overextended breakout or with lots of slippage.
Exit types
Market - whether to keep the existing trade running or whether to close it is determined after close of each bar and exit orders are executed manually upon receiving exit signal.
Stop - We place stop loss orders beforehand when there is a trade in place. This can help in avoiding big movements against trade within bar. But, this may also stop on false signals or fakeouts.
Take profit
Stop - No take profits are configured.
Target - 30% of the positions are closed when take profit levels are hit. Take profit levels are defined by risk reward.
USING THE CODE AS TEMPLATE
As mentioned earlier, I intended to create a fully fledged strategy template. But, ended up creating a fully fledged stratgy. However, you can take some part of this code and use it to start your own strategy. Will explain what all things can be adopted without worrying about the strategy implementation within
Strategy definition : This can be copied as is and just change the title of strategy. This defines some of the commonly used parameters of strategy which can help with close to realistic backtesting results for your coded strategy and comparison with buy and hold.
Generic Strategy Parameters : The parameter which defines controlling alllowed trade direction and trading window are present here. This again can be copied as is and variable inDateRange can be directly used in entry conditions.
Generic Methods : f_getMovingAverage and f_secureSecurity are handy and can be used as is. atr method provideded by pine gives you ATR based on RMA. If you want SMA or any other moving average based ATR, you can use the method f_getCustomAtr
Trade Statements : This section has all types of trading instructions which includes market/stop/limit/stop-limit type of entries and exits and take profit statements. You can adopt the type of entry you are interested in and change when condition to suit your strategy.
Trade conditions and levels : This section is required. But, cannot be copied. All the trade logic goes here which also sets parameters which are used in when of Trade Statements.
Hope this helps.
